
Threshold power (FTP) and training zones
Threshold power is defined as the power output a cyclist can sustain for about an hour. You may also have heard of it being called the “FTP”. This power can be determined through a variety of laboratory or field tests.
The first concept of a functional threshold power came up by the American sports scientist Dr. Andrew Coggan. It is complex to understand the physiological factors that describe the threshold intensity, but research showed that the muscle’s ability to oxidise fuels to produce energy is one of the most important ones (Hausswirth and Le Meur, 2012). Research from Joyner and Coyle in 2008 has demonstrated that an increasing oxidative capacity is one of the main mechanisms for increasing a cyclist’s threshold intensity.
Further, intensity zones can be derived from the threshold power. Here, various models can be approached as well. Generally, these zones are certain percentages of your FTP and used in training plans to define at what intensity the rider should train.
VO2max
The VO2MAX is the maximum rate of Oxygen your body is able to process. The value is especially important, as it gives a clear indication of a rider’s endurance performance. The higher your VO2max value is, the higher your threshold power will be, because your body will be able to process more oxygen for the oxidization of fuels.
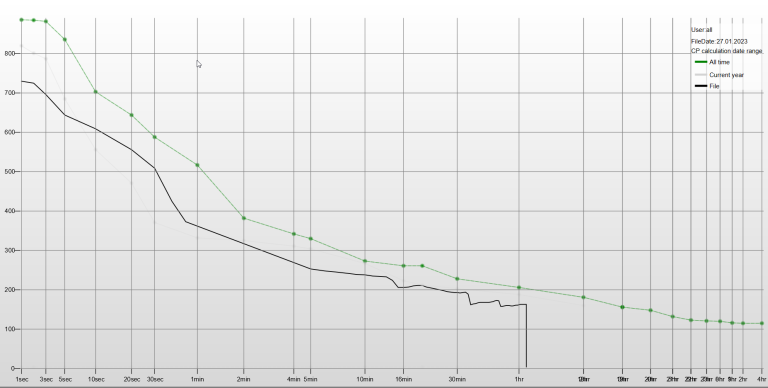
Critical Power (CP)
Critical Power (CP) is used to show how much power a rider can sustain at maximum over a given time. In contrast to the FTP, the critical power model does not only focus on the threshold power over one hour. Instead, the model is used to calculate a rider’s threshold power over any given timeframe. Thus, the CP usually not shown as a single value, but rather as a graph of Power (W) over time (t).
Normalised power (NP)
During a bike ride or race the power output of a rider varies highly due to the impact of wind, mountains or race situations. In order to try and get a more accurate insight of how steady the power output might have been, normalised power has been created.
Another reason for the invention of normalised power has been to display the physiological reactions of the human body more accurately.
To determine NP, a complex mathematical equation is used. It takes the fourth root of the average of the fourth power of the running thirty-second average of the bike ride.
Dividing the normalised power with the average power the variability index can be calculated. This metric tries to give information about the smoothness of a bike ride. Usually the result of the fraction is between 1 and 1.5. The closer the number is to one the more even the training has been.
Intensity factor (IF)
To give a statement about the intensity of a training session you divide your normalised power with your threshold power. The given number is called the intensity factor and typically is between 0.5 and 1.15. A smaller value in this case means that the intensity of the ride was lower than compared to a high number such as 1.02. If the intensity factor is 1.0 the bike ride would precisely be executed at the threshold.
For a correct calculation of the intensity factor, the threshold power needs to be known.The intensity factor is used for further training metrics such as the training stress score (see TSS).
Training stress score (TSS)
Training Stress Score (TSS) was developed by TRAINING PEAKS to quantify the intensity of a training session. For the calculation of the TSS you need the intensity factor (IF), normalised power (NP), functional threshold (FTP) and the ride time in seconds (s). With this value, the metabolic load should be quantified and determine the impact of training on the human body. TSS values lower 150 usually define a performance that has no fatiguing impact on the rider. Values bigger 450 show a high fatigue factor of the cyclist. Yet, the training stress score is highly discussed in sports science as a long and easy ride can hit a high score due to the long time impact.

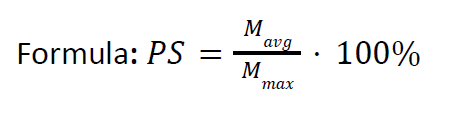
Pedal Smoothness (PS)
Composed to show the smoothness of a pedalling motion, pedal smoothness is defined as the quotient of the average applied torque to the maximal torque in one crank revolution. Usually this value is between 10 and 40 percent. The reason for this quite low number is that the human does not create positive torque along the whole crank revolution. If the calculated value would be 100 %, the rider would apply the force to the pedal absolutely constant – nearly like an engine.
M = Torque
Torque effectiveness (TE)
In order to describe the efficiency of the torque that a cyclist applies to the pedal, the positive and average torque need to be put in a relation. To determine the average torque, the positive and negative shares are needed. Typically, negative torque is a result from riders resting one foot on the back pedal, while pushing the front pedal.
In contrast to Spider PowerMeters, Pedal Powermeters are able to pick this up, as they acquire torque data throughout the whole pedal stroke independently. Common values are between 60 and 100 %. If there is no negative torque, the torque effectiveness is 100 %.

Power balance
As the name suggests the power balance shall show the balance of the left and right pedal. Hereby, the percentage of every leg for the total power is displayed. For the determination the corresponding torque and angular velocity data are needed. This value is helpful to show disbalances between the legs for example after an injury or crash. Typically, the power balance differs by 4-6 percent, i.e., 48 % – 52 %.